Energy Monitoring using Smart plug and Raspberry Pi
Table of Contents
Recently, I became interested in measuring the electricity consumption of electronic devices at my home and, in particular, my computer. Computer power supplies are typically rated from 400W to 800W. I wanted to see how much power is actually needed for day-to-day computing - writing code, browsing the Internet, playing games, running ML jobs. And how does it compare with a laptop and other mobile devices.
As a kid, I was once told by an engineer that the bulk of the energy is consumed by the monitor, and the desktop itself consumes lesser energy1. So if I switch off the monitor, I can play music, download things overnight without wasting too much energy. This statement stuck with me over time as my bulky CRT monitor was replaced with sleek LED monitors and a beefy 250W GPU got added to my desktop. It was time I measure everything and find out if the engineer's statement still holds.
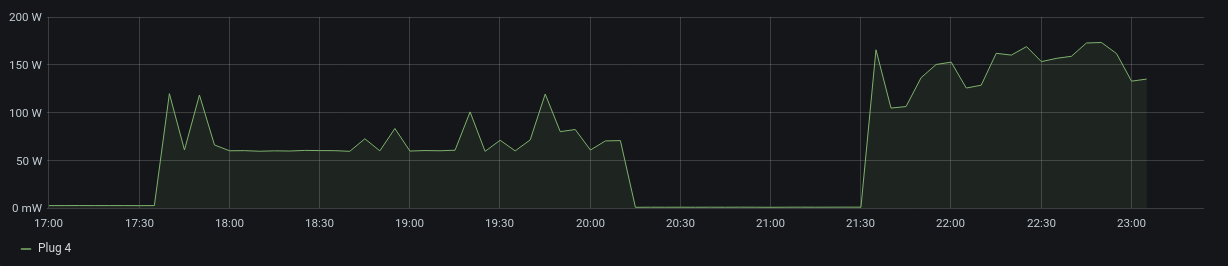
Figure 1: Desktop energy consumption on a weekend evening.
Hardware
A quick search revealed that Kill A Watt meters are one of the most popular ways of measuring the energy consumption. I wanted to log the consumption so that I can analyze the trends over time. That's why I passed these meters on. But these meters have an inbuilt screen and do not require mobile or network access so they can be a great solution if someone is looking for a quick way to see the consumption. On the other end of the spectrum, there are some devices that can be plugged directly into the circuit panel of the house and they can be used to analyze consumption of all appliances in the house. For my goal of measuring energy consumption of my computer, this was simply overkill and would not have provided the fine-grained monitoring I needed (and I'm a little scared of messing with the AC power).
I finally settled on TP-Link Power Strip: HS300. This smart power strip has the usual smart plug features, like, it can be controlled using a mobile app, but it also has energy monitoring built-in. And most importantly there are some awesome projects on Github - python-kasa, pyHS100 - that have reverse engineered the communication protocol and provide a nice interface to talk to them.
Software
Figure 2: Architecture
Figure 22 shows a high-level picture of how the energy consumption values get extracted, stored and visualized.
Polling HS300
The project python-kasa provides a nice interface to control TP-Link devices but there's an issue with querying the energy monitor of child plugs. That's why I used the project pyHS100 which seems like an older version of the python-kasa project. I added a cron job to query the power strip every 5 minutes and dump the data in a text file, using a simple bash script:
#! /bin/bash

power=$(/home/pi/.local/bin/pyhs100 --strip --host <IP of the power strip> emeter | tail -n 1)
timestamp=$(date +%s)

echo -e "$timestamp, $power"
This creates a bulky line for each sample it records and there is certainly a lot of room to compress it. I'm currently sampling it every 5 minutes, so I don't mind it, but if you are planning to sample it every minute or every few seconds, you might want to trim it down.
Grafana Datasource
I'm using Grafana to visualize this data to see trends in usage over time. We can dump all of the data into one of the Datasource that is supported by default by Grafana but I did not like that extra step for such simple data. So I wrote my own backend datasource that directly serves Grafana, data from the logs we collected. This uses the SimpleJson datasource plugin.
Results
The results were informative and nothing less than an eye-opener for me. Some devices, like computers, chargers, consume varying amounts of energy, and some devices, like lamps, monitors, consume constant energy. I might write a follow-up post just about the consumption of my computer running various workloads and applications. Here are few that I found interesting:
Desktop: Coding vs video games
Figure 3: Desktop energy usage: coding, standby, then, playing video games
- In the first half, the computer was used for coding using a simple text editor with light browsing.
- The drop represents the time it was put on sleep.
- The increase during the later part corresponds with playing a low graphics demanding game.
Monitor
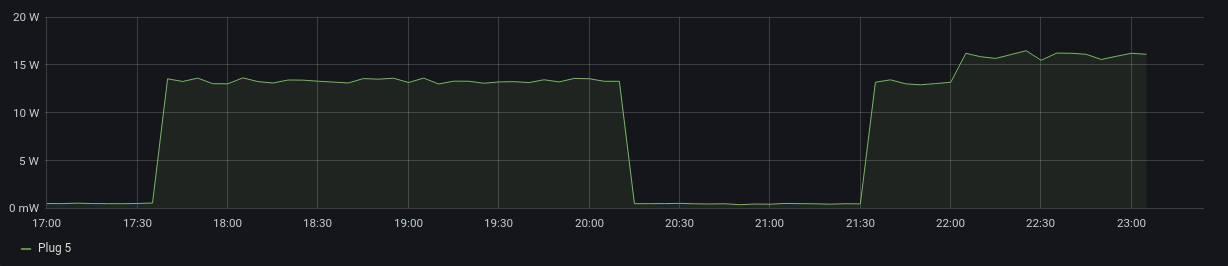
Figure 4: Computer Monitor consumption: almost constant
- Energy consumption of my monitor is constant until I increased the brightness from 15% to 20%
Phone charging
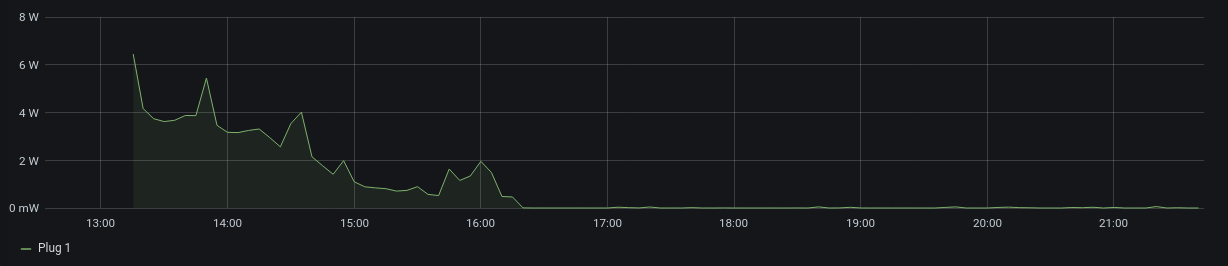
Figure 5: iPhone getting charged using the stock charger.
- This curve is interesting - an exponential decay.
- Note the spikes too, maybe those correspond with the times the phone was picked up.
Conclusion
The energy consumption of the monitor is just 10% - 25% of the desktop energy consumption. So, although it might be still a good idea to turn off the monitor when things are running in the background, monitors are not the major consumers anymore (if they were at all earlier). It is interesting to note that the actual consumption is much less than the rated wattage of the devices.
It is also interesting to note the difference in magnitude of the consumption. So getting a gold rated PSU will have much more impact than having a more efficient iPhone charger. But none of this matters when you are sitting next to a 3KW space heater ;)
Footnotes:
I don't remember the exact statement very well but I suspect my teenage mind might have turned the scale from "monitor consumes a little more than desktop, to, monitor consumes a lot more" to suit its demands.
This figure uses Icons made by DinosoftLabs, Freepik, Icongeek26 from www.flaticon.com
